
How to prepare weather chart for construction site by following 6 steps

Mastering your preparation on a construction site
In the construction industry, weather is one of the most unpredictable and influential variables. It affects productivity, safety, costs, and timelines. From rain-soaked foundations to high winds that stop crane work, weather-related issues can bring a site to a standstill. That’s why having a reliable weather chart is essential—it enables teams to anticipate challenges and act accordingly.
This article provides a comprehensive guide on how to prepare a weather chart for a construction site. It covers everything from defining what a weather chart is, to selecting the right tools, interpreting data, and applying it to real-world decisions.
What exactly is a construction weather chart?
A weather chart for construction sites is a visual planning tool that integrates weather forecasts with daily or weekly construction activities. Unlike a standard weather report, which only tells you the forecast, a construction weather chart connects specific weather parameters—such as temperature, wind speed, and precipitation—to tasks that are weather-sensitive.
Think of it as a bridge between meteorological data and operational planning. The chart allows site managers and engineers to:
- Anticipate delays caused by poor weather conditions
- Schedule weather-sensitive tasks during optimal conditions
- Communicate risks and plans clearly with the entire team
- Ensure compliance with safety regulations and contract timelines
A well-prepared weather chart isn’t just about knowing what the weather will be—it’s about planning what to do with that information.
Why a weather chart is crucial for a construction project
Before we look at how to prepare one, it's important to understand why weather charts are so valuable in the construction context:
- Safety: Severe weather conditions such as lightning, high winds, or extreme heat can pose significant safety risks.
- Planning: Scheduling tasks like concrete pouring or roofing becomes more efficient with weather visibility.
- Resource allocation: Labor and machinery can be deployed more effectively when weather is accounted for.
- Cost control: Unplanned weather-related downtime can lead to expensive delays.
- Contractual compliance: Some contracts require weather-based documentation for delay claims.
Step 1: Identify weather-sensitive activities on site for safety work
Start by mapping out which construction tasks are sensitive to weather changes. This allows you to determine which days or weeks need closer monitoring.
Examples of weather-sensitive activities:
- Earthworks (e.g., excavation and trenching)
- Concrete pouring and curing
- Steel erection
- Roofing and cladding
- Asphalt paving
- Exterior painting and sealing
- Scaffolding and lifting operations
Knowing these will help you tailor the chart to your site’s needs.
Step 2: Define the time frame
Decide how far ahead your weather chart should look and how often it should be updated. Common time frames include:
- Short-term (1–7 days): For daily site operations and shift planning
- Medium-term (1–4 weeks): For sequencing subcontractor work and deliveries
- Long-term (1–3 months): For seasonal planning and budgeting
Most construction managers rely on a rolling 7-day chart that is updated daily based on the latest forecast data.
Step 3: Select reliable weather data sources
Accuracy is key. Don’t rely on just one forecast. Combine multiple data sources for a comprehensive view:
- National meteorological services
- Private weather providers
- Weather APIs for automated systems
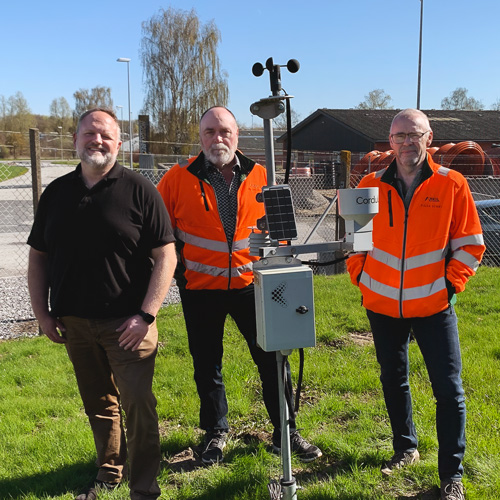
- On-site weather stations for hyper-local data
- Mobile apps or dashboards that compile data into usable formats
A construction-specific platform can pull together local forecasts, project plans, and risk alerts into one interface.
Step 4: Track the right weather parameters
Not all weather elements are equally important. Choose parameters based on what affects your specific site activities:
- Temperature: Relevant for curing concrete and ensuring worker safety
- Rainfall: Affects excavation, paving, and outdoor work
- Wind speed and direction: Critical for crane and lift operations
- Humidity: Impacts drying time for coatings and paints
- Visibility and fog: Relevant for crane and heavy equipment operators
- Lightning and storm alerts: Trigger safety shutdowns or evacuations
Use defined thresholds to categorize risk—e.g., “crane shutdown if wind exceeds 40 km/h”.
Step 5: Choose your charting tool
The format of the chart matters. Choose a visualization method that your team can understand quickly.
- Spreadsheets: Great for customizable formats with color-coded risk levels
- Project scheduling tools: Useful for integrating weather with Gantt charts
- Construction platforms: Often include native weather charting tools
- Dashboards: Excellent for real-time data tracking and mobile accessibility
Use icons, color codes (green = safe, yellow = caution, red = stop), and labels to make the chart easy to interpret at a glance.
Step 6: Update and communicate regularly
A weather chart only helps if it’s kept current and shared widely:
- Daily briefings: Quick reviews with site leads to adjust plans
- Weekly meetings: Align forecasts with upcoming tasks and deadlines
- Alerts and mobile access: Send push notifications for sudden changes like storms or heatwaves
Make the chart accessible to all relevant personnel via printouts on site boards, tablets, or phones.
Advanced tips for better weather charting
Integrate with project scheduling tools
Link the weather chart directly with your construction schedule so you can see potential clashes between planned tasks and weather risks.
Factor in local microclimates
Weather can vary dramatically over short distances. Install a local weather station to capture real-time site-specific data.
Use historical weather data
Reviewing historical patterns can help you estimate likely disruptions in upcoming months or seasons.
Incorporate AI and automation
Some platforms offer AI-based impact predictions, such as how wind might affect crane operation or how heat impacts concrete settings.
Prepare contingency plans
Include alternate work plans or buffer days in your schedule so you can pivot when adverse weather occurs.
Use visual cues to communicate risk, such as red text for dangerous days and bold for task-critical impacts.
Common mistakes to avoid
- Depending on one forecast source: Always compare multiple data streams
- Not updating the chart regularly: Forecasts change rapidly
- Poor communication: If workers don’t see or understand the chart, it loses its value
- Ignoring seasonal patterns: Not every storm is a surprise; look at history
- Failing to plan for alternatives: Have indoor or prep work ready as backups
Follow the steps to prepare for adverse site weather
A weather chart is much more than a forecast—it’s a decision-making tool. By preparing a site-specific weather chart, you can dramatically improve how your construction project responds to the environment. You’ll reduce risks, boost productivity, and keep workers safe.
Whether you’re managing a small job site or a massive infrastructure project, integrating weather data into your planning is no longer optional—it’s an essential part of modern construction management.
Published:
May 13, 2025
Latest posts
.webp)

%20(1)%20(1).webp)
.webp)


%20(1).webp)


.webp)

.webp)


.webp)

_web.webp)


.webp)


Trusted by thousands of customers, Cordulus provides accurate and reliable weather information to decision makers when it matters most.