What a weather chart should record
Keep it short. A chart nobody fills in is worth nothing. Eight columns and a weekly signature is enough for most projects.
A weather report turns measurements into decisions you can act on, and into the record you need when a delay is questioned or you are making a weather chart for your construction site. Here is: what to record, how to build one, and a real 24-hour report from one of our stations on a working site.


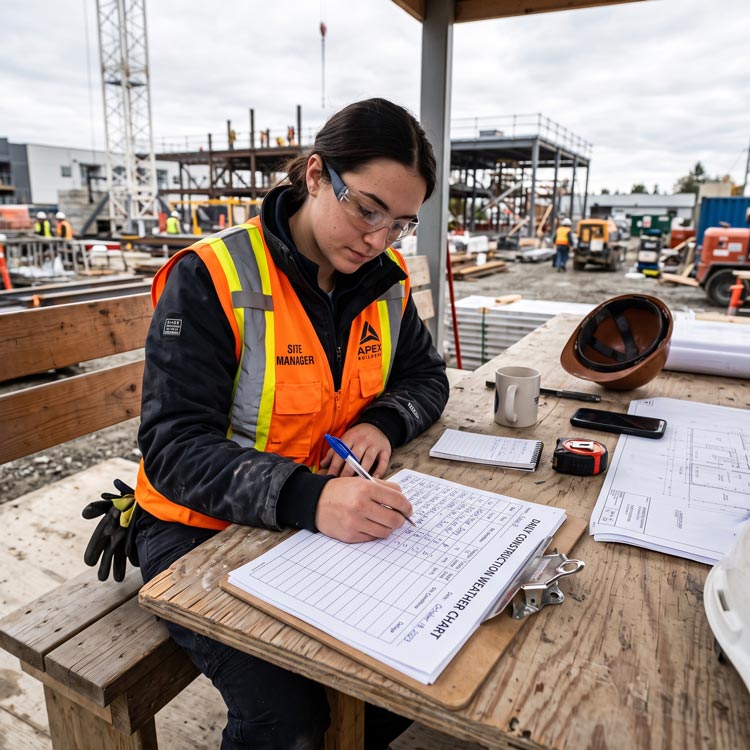
A construction weather chart is a daily record linking weather conditions to the activities they affected. A forecast tells you what might happen. A weather chart records what did happen, and what it stopped - which is what a delay claim, a safety review or a programme revision actually needs.
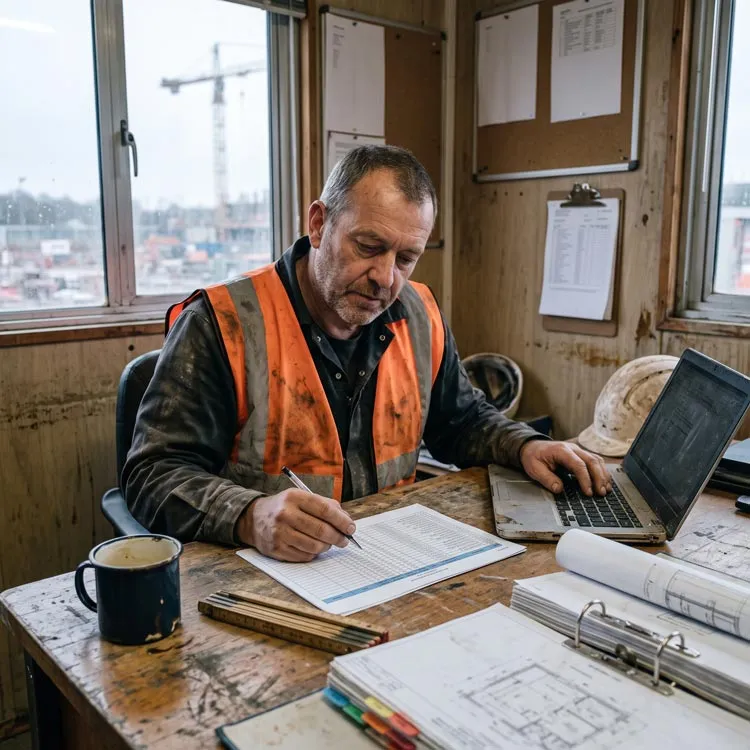
It is narrower than a site diary, which covers everything that happened on site, and more detailed on weather than a daily log. Many contractors keep the weather chart as an appendix to the site diary.
Keep it short. A chart nobody fills in is worth nothing. Eight columns and a weekly signature is enough for most projects.

The is an example of how a week of a real weather chart could look like

Three millimetres of rain fell across four hours. A regional station would report a daily total and tell you nothing about when. This record shows which hours were workable and which were not - the difference between a claim you can evidence and one you cannot.
1. Identify the weather-sensitive activities on your programme. Not every task stops when the weather turns, and you only need to monitor the ones that do.
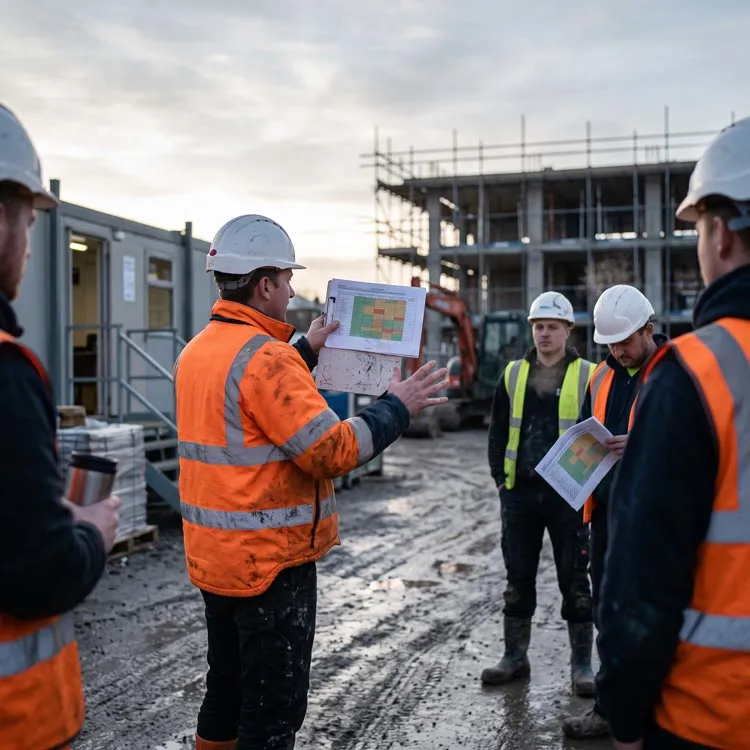
2. Set your time frame. Most site managers run a rolling seven-day view updated each morning, with a longer view for seasonal planning.
3. Choose your data sources. A forecast for the outlook, on-site measurement for what actually happened. Do not rely on just one.
4. Pick your parameters. Temperature, rainfall, wind speed and gust, humidity. Add visibility and lightning if they affect your operations.
5. Choose the format. A spreadsheet with colour coding works well. Green for proceed, yellow for caution, red for stop.
6. Update and share it daily. Two minutes at the morning briefing.


Various activities are impacted by different weather parameters, but they can all result in delays.
There are two different questions here, and mixing them up is where weather claims go wrong. Whether conditions are unsafe is a technical question, answered by your lift plan, the manufacturer's limits and the applicable standards.
Whether a day is claimable is a contractual question, is answered by your contract.
Agree your thresholds in writing before work starts, record them in the project execution plan, and share them with subcontractors. Arguing about the threshold after the event is the most common reason a well-documented claim still fails.
Link to article

The report arrives as a filled-in Excel file. What you do with it is up to you.
Most contractors start with the second, then move to the third once they see how much of it can be filled in automatically.
I want the report sampleA weather chart on its own is a record, not a claim. What turns one into the other is the sequence around it - a baseline to measure against, actuals data rather than forecasts, and a notice sent inside the window your contract allows. Miss any one of those and a thoroughly documented delay can still be rejected.
1. Baseline the programme first, so there is a reference point for what counts as a delay.
2. Record actuals, not forecasts. A forecast proves nothing after the event.
3. Log what the weather stopped, not just what the weather was.
4. Note the hours lost. Partial days often accumulate under the contract.
5. Issue the delay notice inside the contractual window, frequently seven days or less.
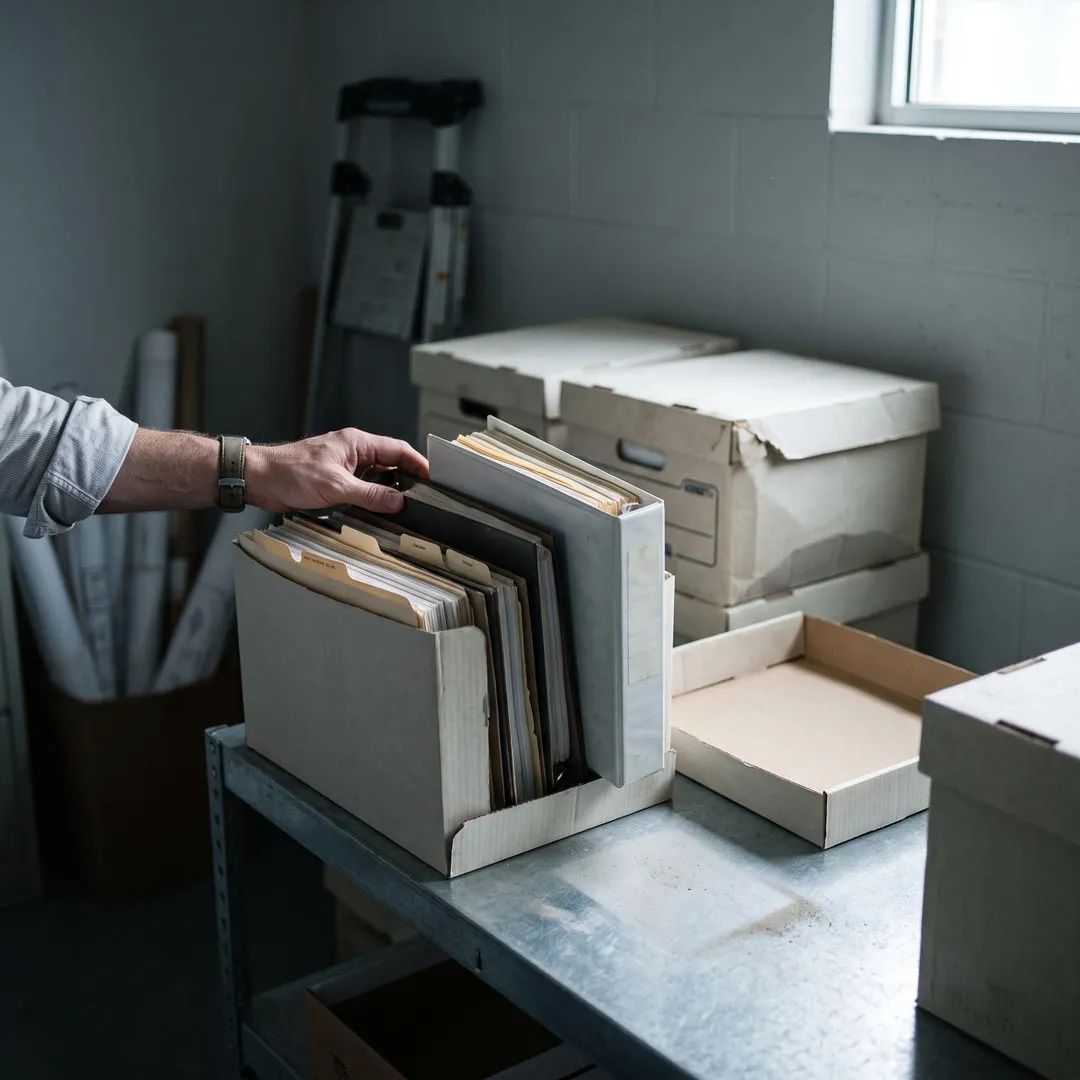
6. Keep the record after completion. Disputes surface long after practical completion.

Once a station is on site, it records the weather conditions. That record answers three different questions.
Evidencing weather delays
Planning weather-sensitive work
Reviewing after the fact
Plenty of sites run a perfectly good weather chart on paper or in a spreadsheet, and it costs nothing but somebody's time. The difference shows up months later, when someone asks what the conditions were on a specific Tuesday afternoon and the answer has to hold up. Here is the same job, done both ways.

.webp)
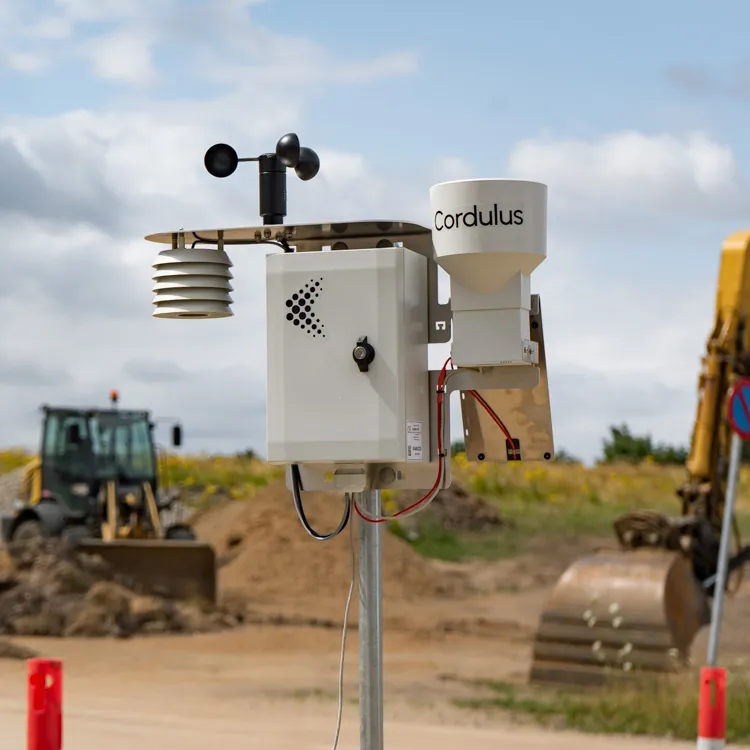
A solar-powered weather station built for construction sites, with a SIM card inside. It installs on any of your sites in about ten minutes, with no power cables and no Wi-Fi needed.
It records continuously from the day it is switched on, and you can export Excel or CSV for any date range.
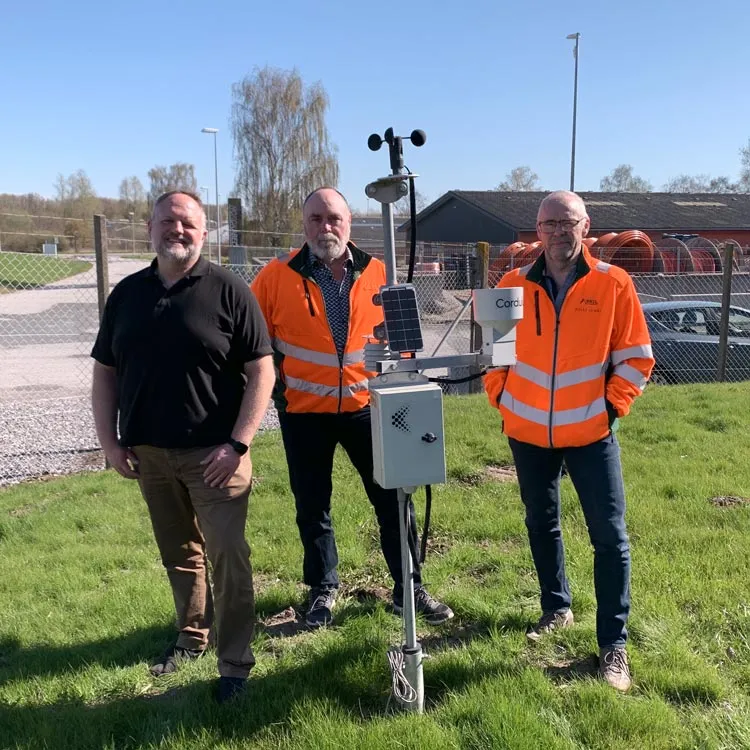
Arkil installs district heating pipes across Denmark, where the difference between a "light rainy day" and a documented adverse weather day can be worth hundreds of thousands of kroner. Project manager Palle Lumby describes the usual pattern: the contractor claims 30 weather days, the client accepts 10, and both settle at 20 on gut feeling - and those ten lost days can mean DKK 200,000 in fines alone. With a station on the site itself rather than a DMI reading 30 kilometres away, those conversations now start from evidence.
Read the case study
Get our weather report from a real Cordulus weather station with hyperlocal weather readings from a real construction site.

Get answers to you questions here about Cordulus Site Subscription and more.
It is a yearly subscription that includes the weather station, maintenance, app access, and support. Request a quote on our pricing page and sales will contact you with the current rates
Yes. It installs in about ten minutes and has GPS tracking, so you can move it when a project finishes.
Neither. The station is solar-powered and sends data over the mobile network using a built-in SIM card.
Yes. If all parties agree that the format and column structure is sufficient, add all the necessary notes all parties need, clear old the readings, and have a weather chart ready to fill in by hand.
Normally the site manager or works supervisor, as part of the daily record. The contract sometimes names the responsible party explicitly.
At least as long as the contractual liability period, and usually longer. Disputes surface well after practical completion.
It depends on the mix and the standard you are working to. What matters for documentation is that you can show the temperature at the time of the pour, measured on site.
Commonly around 40 km/h, but it depends on the crane, the load and the manufacturer's limits. Your lift plan is the authority, not a general figure.
A site diary covers everything on site. This covers the weather in far more detail, and is often attached to the diary as an appendix.
Usually not. Contracts generally require conditions measured at or near the site.
Yes, you can export Excel or CSV, for any period the station has been running on your construction site.
For your own station, from the day it is installed. Ask us about historical data for your area.