Support energy operations withon-site weather data

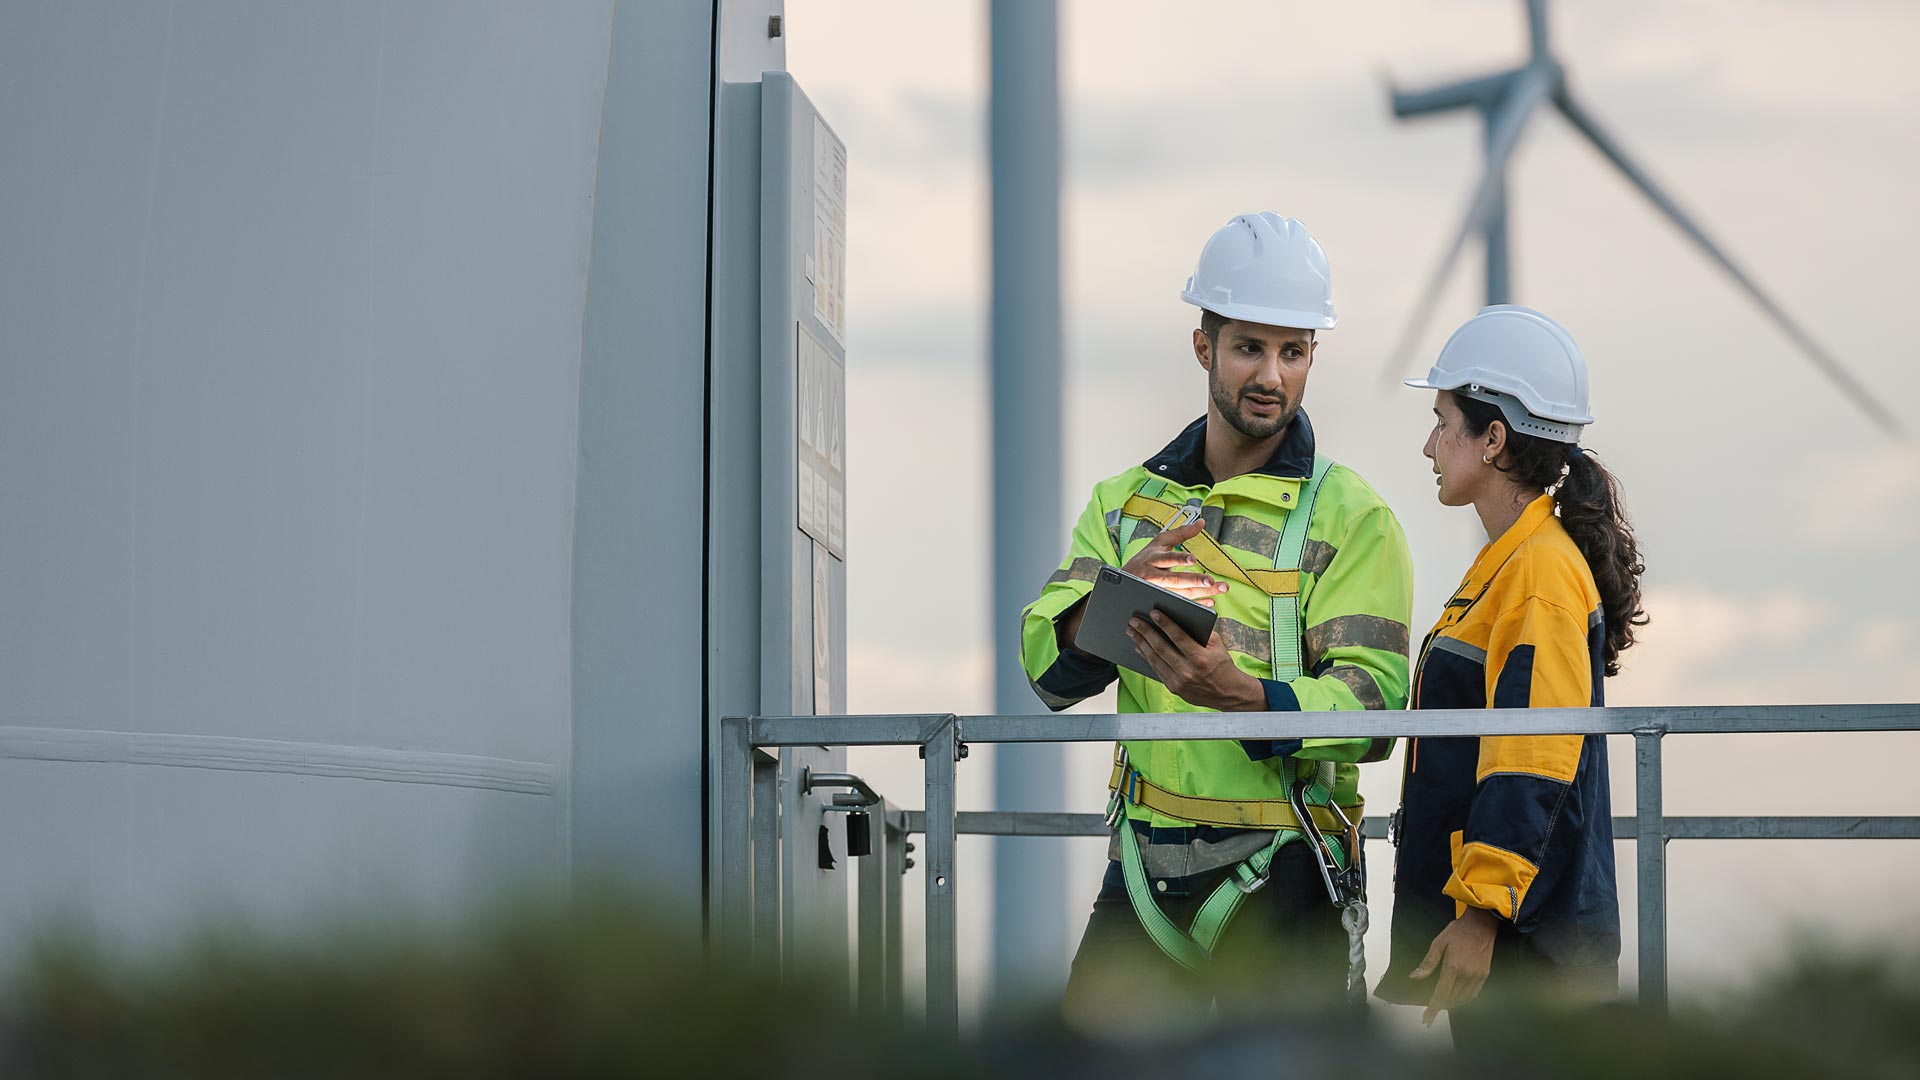
Turn measured site conditions into alerts, riskgauges, verified logs and integrations - so every weather call is made on datafrom where it matters.

Cordulus Construction weather station at a construction site

Custom alerts and risk gauges

Every energy site has thresholds: the windspeed that stops a lift, the gust-and-direction combination that stows atracker, the temperature that changes a production plan. Cordulus alerts areconfigured to YOUR thresholds and delivered in real time - and for specificoperational needs we configure custom analytical views, such as a windspeed/direction risk gauge.

Alerts on your thresholds -wind, gusts, direction, rain, temperature.
Customrisk gauges configured for your operational rules.
Notifications that promptaction, not noise.
Weather vane
Stevenson screen three-in-one sensor on the Cordulus Farm weather station

A verified record of site conditions

When weather stops work, damages equipment ortriggers a contract clause, the question is always the same: what were theconditions, exactly, at the site? Cordulus logs every measurement, giving you averified local record for claims, warranty questions and contractual weatherdefinitions.

Continuous, site-specificcondition logging.
Support weather-day claims anddowntime adjudication with measured data.
Reduce disputes withcontractors, insurers and clients.

Integrate weather into the tools you already use

Cordulus' weather API delivers real-timemeasurements, forecasts and alerts into your own systems - O&M planningtools, project management platforms, demand forecasting models, or controlsystems, including tracker OEM integrations for automated stow workflows.

REST API with real-time,forecast and historical data.
Feed planning, monitoring andcontrol systems directly.
One integration, every site.
Weather vane
Stevenson screen three-in-one sensor on the Cordulus Farm weather station

Every site on one dashboard

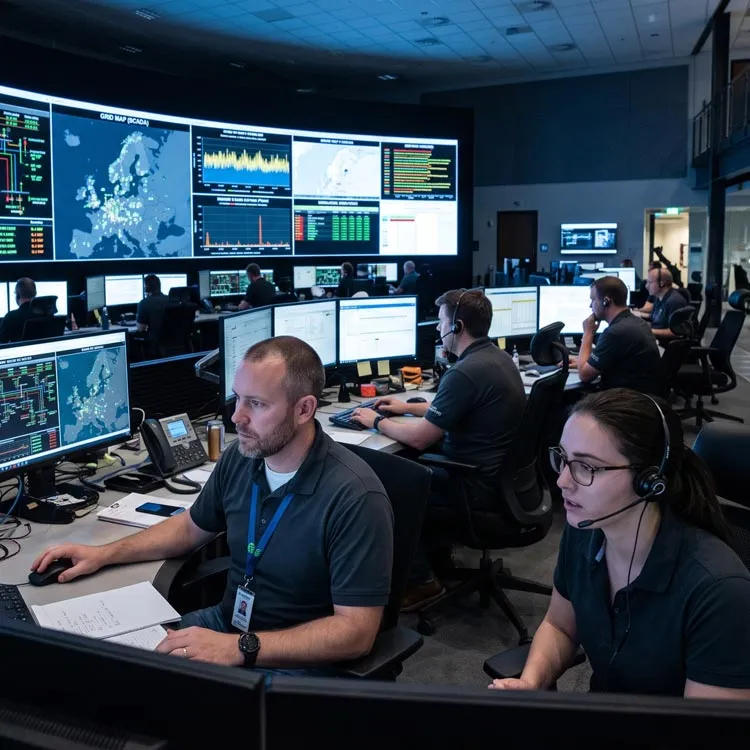
Portfolios are run from a desk, not a singlesite. The Cordulus dashboard puts all your locations on one screen — liveconditions, forecasts and alerts side by side — so you can compare sites andmove resources to where the weather allows work.

Live view of every site inyour portfolio.
Compare conditions acrosslocations to redeploy crews.
Independent measured data forperformance and reporting.

Historical data for better planning

A station on site learns your local weatherpatterns from day one. Over time, that history sharpens planning: realisticweather-day budgets, better maintenance calendars, and AI-enhanced forecastscorrected against measured local conditions - up to 52% more precise thanstandard forecasts.

Buildweather-day expectations on local history, not national averages.
Plan maintenance seasons onmeasured patterns.
Forecasts that improve as yourstation learns the site.
Weather vane

Ready to see your sites' weather clearly?

Sky with rain clouds over green forest